
How to use an AI agent to reason about frontend performance
Learn how to guide an AI agent to measure and improve React or Vue frontend performance with SSR, caching, lazy loading, and before-and-after validation.
An AI agent is more useful for performance work when it measures before changing code. SSR, caching, and lazy loading are hypotheses: the gain only exists when a reproducible comparison confirms it.
Performance does not start with a technique
When an application starts receiving more traffic, the conversation often becomes a familiar checklist: use SSR, add lazy loading, configure caching, reduce the bundle, optimize images, or put a CDN in front. All of these can help, but they do not solve the same problem.
SSR can improve initial content delivery while increasing server work if every visit requires a fresh render. Lazy loading can reduce initial JavaScript while making loading worse if it hides the main content. Caching can reduce latency and origin load, but it can also serve stale information or share a personalized response in the wrong place.
The useful question, then, is not “which optimization is missing?” It is “which behavior is slow, what evidence shows it, and what is the smallest experiment that can improve that signal?” This is where an AI agent can be genuinely useful.
“High traffic” hides two different problems
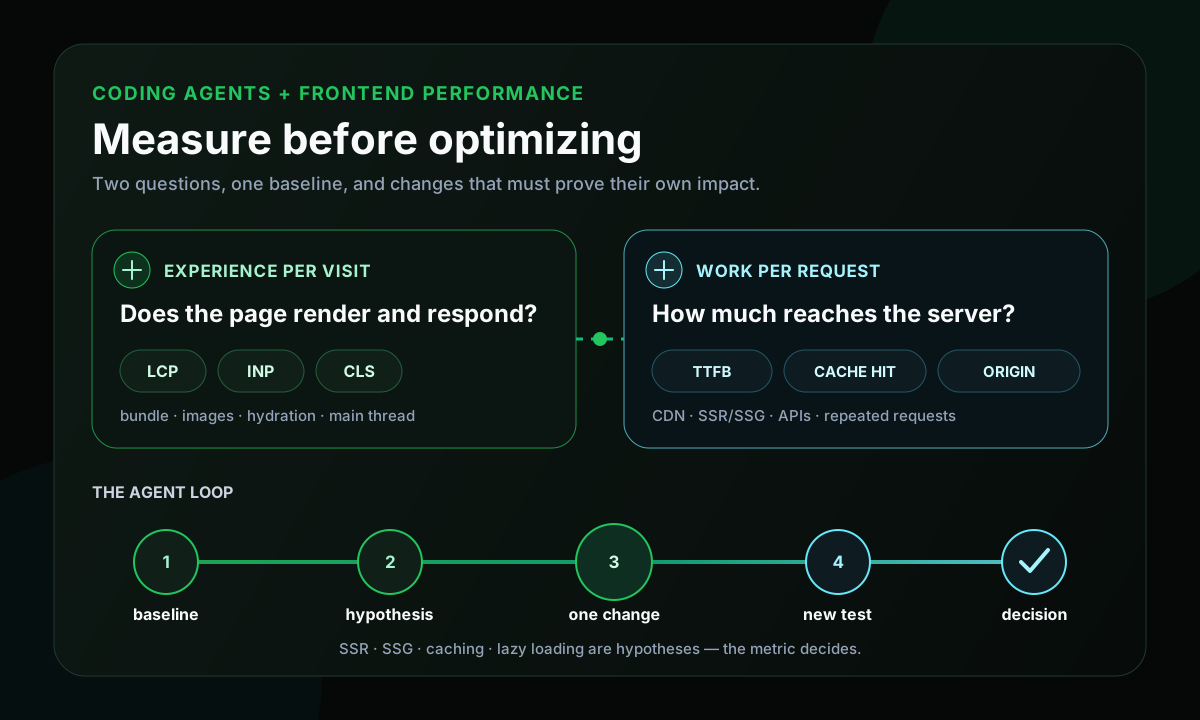
1. Each user’s experience
The first question is: does the page appear, stabilize, and respond quickly for the person using it? This is where LCP, INP, and CLS—the current Core Web Vitals—matter, along with the amount of JavaScript transferred and executed, long tasks on the main thread, and the size and priority of images, fonts, and other resources.
Lab tools are useful during development, but they do not replace field data. Lighthouse, for example, cannot measure real INP because that run does not contain a representative sequence of user interactions. TBT can signal main-thread blocking, but it should not be presented as the same metric.
2. The work repeated for every visit
The second question is: how much work do the application, server, and APIs repeat for every visit? Relevant signals include TTFB, cache-hit rate, requests reaching the origin, renders per visit, duplicate calls, transferred data, saturation, queues, timeouts, and error rates under load.
A page can have a good lab score and still put pressure on the server because it queries and renders the same data for every request. The opposite can also happen: a static page may absorb heavy traffic at the CDN while still shipping too much JavaScript to a low-end phone. Lighthouse is not a load test, and a load test does not replace Core Web Vitals.
The prompt “make my site faster” is too small
A coding agent can read components, configuration, dependencies, and build output, and it can control a browser. Even so, a vague request may lead it to refactor an irrelevant area, spread memoization without profiling, split components that are too small, delay the LCP image, or turn a route into SSR without considering caching and origin cost.
1measure2 -> locate the bottleneck3 -> formulate a hypothesis4 -> change one thing5 -> measure again6 -> decideThe agent should not start by writing code. It should start by building a baseline and making clear what was measured, what was inferred, and what could not yet be verified.
The minimum context for a useful audit
- Framework, version, and production build command.
- Deployment model, CDN, origin, and the most important routes.
- Which pages are public, personalized, or authenticated.
- Data update frequency and validity rules.
- Predominant devices and networks, when that data exists.
- Behavior, SEO, and accessibility requirements that must not change.
- Available field metrics and performance budgets.
1For every conclusion, label it as:2- measured3- inferred4- not verifiedSeven straightforward areas the agent can investigate
The goal is not to apply all seven. It is to find which ones address the measured bottleneck with the lowest risk.
1. Choose a rendering strategy per route
SSR, SSG, and CSR should not be global decisions made from architecture labels alone. An article or low-volatility landing page can be static. A public page updated every few minutes can use revalidation. An authenticated area may require dynamic rendering. A highly interactive screen can keep parts on the client without forcing the entire route to begin as an empty SPA shell.
Question for the agent: which parts of this route truly depend on the current request, and which could be static, cached, or revalidated?
2. Configure caching according to validity
Caching can exist in the browser, CDN, rendered HTML, data requests, and versioned assets. Hashed files can usually use long-lived immutable caching; HTML often needs a different policy. Authenticated or personalized responses require extra care so they never become public in a shared cache.
- What will be stored, and for how long is it valid?
- Is the response public or private?
- Which event requires invalidation?
- What happens when the cache expires?
- How will cache hits and avoided origin traffic be measured?
3. Lazy-load only what is not critical
A modal, editor, map, heavy chart, below-the-fold player, or route that may never be visited are good candidates. The image or content that forms LCP is not: the main resource needs to be discovered early and receive appropriate priority. Delay what does not participate in the initial experience while preserving the path to the main content.
4. Ship and execute less JavaScript
The agent can look for heavy dependencies used for small tasks, imports that hurt tree-shaking, libraries loaded on every route, broad client-side boundaries, static components hydrated unnecessarily, third-party scripts in the critical path, and unused code in the initial bundle. In React and Next.js, review the scope of use client. In Vue and Nuxt, inspect hydration cost and plugins executed at startup.
5. Review images, fonts, and visual stability
Missing dimensions, files larger than their rendered size, missing responsive variants, insufficient compression, an LCP image without priority, and offscreen media loaded too early are common opportunities. Reserved width, height, or aspect ratio helps reduce CLS. Too many font families, weights, and styles also increase transfer and can delay text.
6. Remove waterfalls and duplicate requests
1fetch user2 -> fetch permissions3 -> fetch catalog4 -> fetch recommendationsIf catalog and recommendations do not depend on permissions, some calls can run in parallel. The agent may also find a request made on the server and repeated during hydration, sibling components querying the same resource, payloads larger than the screen uses, and aggressive prefetching that creates traffic without value.
7. Reduce expensive renders and lists after measuring
Not every bottleneck appears during loading. Search can freeze while typing, a filter can update hundreds of components, and a table can create thousands of DOM nodes. Framework profilers and the browser performance panel can reveal unstable props, repeated calculations, lists without pagination or virtualization, and long tasks. Memoization comes after evidence, not before it.
A practical example in React and Vue
Imagine a public catalog with a title, main image, products updated every few minutes, interactive filters, a comparison chart opened on demand, and reviews below the fold. An initial hypothesis could keep the page structure static, revalidate the list within the accepted window, keep filters on the client, and load the chart and reviews only when needed.
1'use client';23import dynamic from 'next/dynamic';4import { useState } from 'react';56const ProductChart = dynamic(() => import('./ProductChart'), {7 loading: () => <p>Loading comparison...</p>,8});910export function CompareButton() {11 const [showChart, setShowChart] = useState(false);1213 return (14 <section>15 <button onClick={() => setShowChart(true)}>Compare products</button>16 {showChart ? <ProductChart /> : null}17 </section>18 );19}In the Next.js example, the gain does not come from using dynamic alone. It comes from keeping the heavy chart out of the initial load and possibly never downloading it for people who do not open the comparison. The agent should still confirm chunk separation in the build, review the scope of use client, and preserve the main image priority.
1<script setup lang="ts">2import { defineAsyncComponent, ref } from 'vue';34const showChart = ref(false);5const ProductChart = defineAsyncComponent(() => import('./ProductChart.vue'));6</script>78<template>9 <section>10 <button @click="showChart = true">Compare products</button>11 <ProductChart v-if="showChart" />12 </section>13</template>In Vue, defineAsyncComponent expresses the same intention. In Nuxt, an auto-imported component can use the Lazy prefix, and current versions also offer delayed hydration. The API detail changes; the intention remains to preserve critical content, split optional code, avoid unnecessary hydration, and confirm the result in the build and browser.
A better prompt for the audit
1Act as a frontend performance diagnostic agent.23Objective:4Identify the three highest-impact opportunities for [ROUTE],5considering both per-visit experience and repeated work per request.67Context:8- stack and versions: [REACT/NEXT OR VUE/NUXT]9- deployment: [PLATFORM, CDN, AND ORIGIN]10- route type: [PUBLIC, PERSONALIZED, OR AUTHENTICATED]11- data update frequency: [FREQUENCY]12- build command: [COMMAND]13- behavior that must not change: [CONSTRAINTS]1415Success means:16- run a production build and record a baseline;17- inspect the bundle, waterfall, initial HTML, hydration, images,18 fonts, third-party scripts, and cache headers;19- separate measured facts, inferences, and missing data;20- evaluate SSR/SSG/CSR, lazy loading, caching, and less JavaScript21 only when they address the observed bottleneck;22- prioritize no more than three hypotheses by impact, confidence, effort, and risk;23- identify the affected metric and validation method for each hypothesis;24- do not change code during this stage.2526Constraints:27- do not treat a single Lighthouse score as sufficient evidence;28- do not present TBT as field INP;29- do not invent percentage improvements;30- do not lazy-load the LCP element without justification;31- do not put personalized responses in shared caches;32- do not recommend SSR as a universal solution.3334Output:351. baseline summary;362. bottlenecks with evidence;373. prioritized hypothesis table;384. plan for the smallest useful experiment;395. gaps that require production data.Implement one hypothesis at a time
1Implement only the approved hypothesis: [HYPOTHESIS].23Preserve behavior, accessibility, SEO, and correct data freshness.4Run the same build and repeat the same measurement under baseline conditions.56When finished, report:7- files changed;8- baseline and result for every relevant metric;9- variation between runs;10- side effects or risks;11- recommended decision: keep, revise, or discard.1213If the evidence does not show a consistent improvement, do not present the change as a gain.Separating diagnosis from implementation avoids mixing several changes and then losing track of which one affected the result. It also makes it possible to reject a technically interesting solution when it does not deliver enough value in that context.
Plugin or skill: what actually helps?
For this work, I would not start with a generic plugin. The agent mainly needs access to the repository, terminal, build, and a browser. An infrastructure-provider plugin can complement the analysis when it exposes real CDN, caching, or edge metrics, but it does not replace profiling, field data, or controlled testing.
A local skill named frontend-performance-audit can be more useful because it preserves the method: detect the stack, create the build, measure the route, inspect HTML, waterfall, hydration, and caching, separate facts from hypotheses, implement an approved change, and produce a before-and-after report. Stack-specific references for React/Next, Vue/Nuxt, and Vite SPAs can live inside the same skill.
The skill does not add a secret capability to the model. It makes the audit repeatable so the next review does not depend on remembering the entire prompt.
How to know whether the change actually helped
Network conditions, device temperature, background processes, warm caches, location, and server load create variation. A reliable comparison records the build, route, scenario, device, network, cache state, number of runs, median, spread, and the distinction between lab and field data.
The result should not be only an overall score. A change can improve LCP while increasing JavaScript, reduce the initial bundle while delaying an important feature when opened, or lower TTFB with caching while keeping content stale for too long. The trade-off belongs in the report.
A performance budget as regression protection
- Maximum size for a route’s initial chunk.
- Limits for the main image and third-party JavaScript.
- An alert when the bundle grows beyond the defined tolerance.
- Required review for new client-side boundaries.
- Cache-header checks for public assets.
The agent should not invent the numbers. They need to come from the application, its audience, and its baseline. After that, the agent can review diffs and identify regressions before they accumulate.
Practical checklist
- Which route matters most, and is the analyzed build a production build?
- Is the problem loading, interaction, or capacity under traffic?
- Is field data available, or only lab data?
- Which element forms LCP, and how much JavaScript arrives first?
- Is optional code loaded too early?
- Is SSR doing fresh work on every visit?
- Which routes could be static or revalidated?
- Do HTML, APIs, and assets have coherent caching policies?
- Could a personalized response enter a shared cache?
- Are there duplicate requests, waterfalls, or large lists?
- Which metric should improve, and how will the same test be repeated?
- Which result would cause the hypothesis to be discarded?
Limits and caveats
This article does not replace profiling, load testing, RUM, framework documentation, or knowledge of the real deployment. The snippets illustrate architectural intent; rendering, caching, revalidation, and hydration APIs change across Next.js and Nuxt versions and must be checked before implementation.
There is no universal budget. An editorial page, internal dashboard, and graphics editor serve different audiences and priorities. Not every Lighthouse recommendation should become a task, not every dynamic route should be static, and not every cache is safe. No agent knows real user behavior when that data is unavailable.
Conclusion
An AI agent can navigate the project, identify routes, analyze dependencies, run the build, inspect the page, and connect code to metrics. The value does not come from asking it to “make everything faster.” It comes from providing context and requiring evidence.
When the prompt asks which route is critical, whether the problem is in the browser or in repeated server work, which metric must change, and how the test will be repeated, the agent stops being a suggestion generator and starts participating in a technical experiment. This is a disciplined use of AI: helping us measure, compare, and decide.